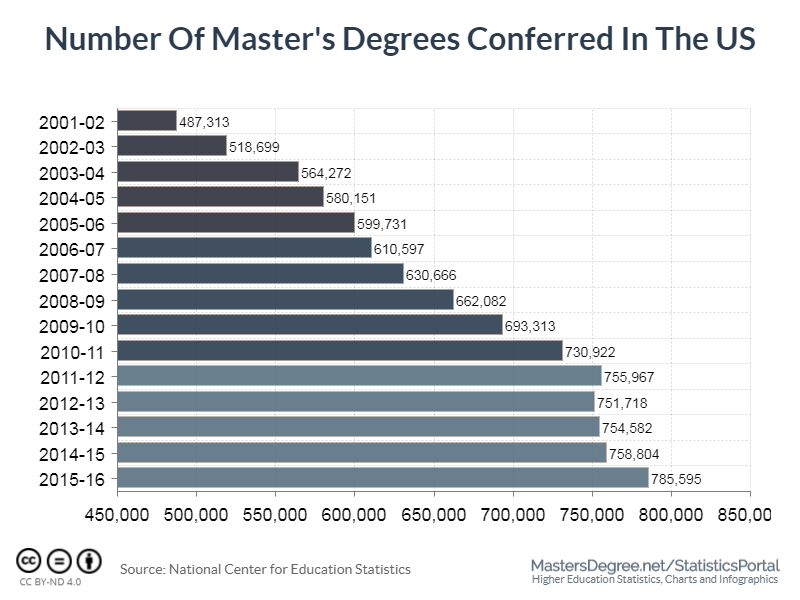
The percentage of Master’s degree educated people in the US has experienced a continual growth during the past years, reaching 785,595 Master graduates in 2015/16. If we compare it to the 2011/12 graduates we notice an increase of 4%.
Business, Education and Health professions shared the highest portion of these graduates in 2015/16. Out of the total number of Master’s graduates, 186,834 of them were in Business programs, 145,781 were in Education and some 110,348 were in Health Professions.
In terms of race, Black and Hispanic people holding a Master degree were outnumbered by White ones. Almost 55% of Master graduates in 2015/16 in the USA were White people or roughly speaking 431,850. Black Master educated people accounted for just 88,817 and Hispanic people accounted for just 62,946.
Among people aged between 25 and 29 only 9.2 % of them had a Master degree or higher, 2.3 % more than in 2011.
Females aged between 25 and 29 were most likely to have attained a diploma in a Master program. In 2016, 11.2% of females aged between 25 to 29 had a Master degree and according to these statistics, in 2017 this percentage dropped at 10.5%.
On the other hand, 7.2% of males aged 25 to 29, had a Master educated or higher in 2016, and by contrast to females, in 2017 the percentage of Maser educated males increased slightly at 7.8%.

